实例——扒了200多天的2万条聊天记录,我发现了群聊的秘密")
用Python进行探索性数据分析(EDA)实例——扒了200多天的2万条聊天记录,我发现了群聊的秘密
介绍
在学习完Jovian.ml网站上为期六周的Data Analysis with Python:Zero to Pandas课程之后,我终于可以完成我的课程项目:WhatsApp对话分析了。而在这个项目中,我学到的很有用的一点,就是学会如何用Python做探索性的数据分析(Exploratory Data Analysis)。
之所以选择WhatsApp作为分析对象,是因为我一直想要更加了解自己在聊天室的日常对话行为,而且我从Prajwal Prashanth的项目分享中获得了很多项目灵感。
通过这个项目,我希望我可以更加了解我和朋友群聊时的聊天行为,例如我们通常聊天的有效时长,我们通常使用多少表情符号等等。那就让我们开始吧!如果你想了解更多数据分析相关内容,可以阅读以下这些文章:
数据科学与数据分析傻傻分不清楚?这篇文章为你解惑…https://www.dataapplab.com/data-science-vs-data-analytics/
数据分析的四种类型https://www.dataapplab.com/4types_of_dataanalysis/
如果你想成为一名称职的数据分析师,请把你刷微博的时间都拿来看看这些…https://www.dataapplab.com/dataanalysis_blog/
用到的数据集
在这个项目中,我们要用到WhatsApp聊天中的个人数据集。每个人都可以通过以下操作在WhatsApp中导出自己特定对话的数据集:

我选取了一个大学同学聊天群,并下载了2020年2月5日至2020年9月21日期间的实时聊天作为项目数据集。这个群有三个群成员:我 (Pei Yin),Ed和Rohit,我们建群的主要目的是交流知识和思想。
代码详见:https://jovian.ai/edsenmichaelcy/whatsapp-chat-analysis-course-project
01 导入基础库&读取数据集
import plotly.express as px
import os
import pandas as pd
import re
import datetime as time
import jovian
import numpy as np
import matplotlib.pyplot as plt
import matplotlib
import seaborn as sns
import emoji
import re
from collections import Counter
from wordcloud import WordCloud, STOPWORDS
导入所需的库
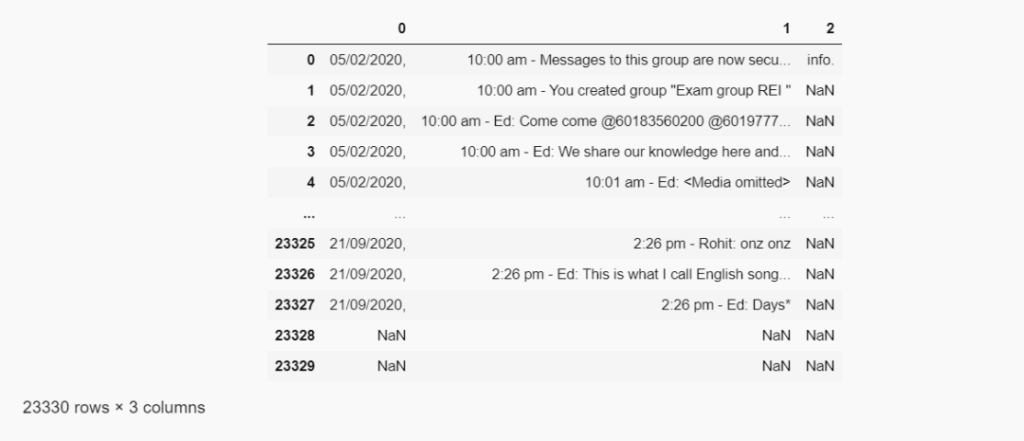
whatsapp_df = pd.read_fwf('Chat.txt', header = None)

whatsapp_df
  0  1  2
0  05/02/2020,  10:00 am - Messages to this group are now secu...  info.
1  05/02/2020,  10:00 am - You created group "Exam group REI "  NaN
2  05/02/2020,  10:00 am - Ed: Come come @60183560200 @6019777...  NaN
3  05/02/2020,  10:00 am - Ed: We share our knowledge here and...  NaN
4  05/02/2020,  10:01 am - Ed: <Media omitted>  NaN
...  ...  ...  ...
23325  21/09/2020,  2:26 pm - Rohit: onz onz  NaN
23326  21/09/2020,  2:26 pm - Ed: This is what I call English song...  NaN
23327  21/09/2020,  2:26 pm - Ed: Days*  NaN
23328  NaN  NaN  NaN
23329  NaN  NaN  NaN
23330 rows × 3 columns
读取文本文件
在这里,我们首先导入要用到的库,然后使用pandas或pd.read读取文本文件。
02 数据准备和清洗
- 理解数据
在开始任何分析之前,我们都需要理解数据及其含义:
理解数据:
- 数据集有3列;
- 数据集包含日期、文本和NaN值;
- 使用info(),我们可以发现每个对象(每列)的行数是不平衡的,因为数据集中一共有21k条消息,但有些列只有23k或700个值;
- 知道数据集中存在空值之后,我们现在就可以清理数据了
whatsapp_df.info()
<class 'pandas.core.frame.DataFrame'>
RangeIndex: 23330 entries, 0 to 23329
Data columns (total 3 columns):
 #   Column  Non-Null Count  Dtype
---  ------  --------------  -----
 0   0       23177 non-null  object
 1   1       23087 non-null  object
 2   2       788 non-null    object
dtypes: object(3)
memory usage: 546.9+ KB
数据信息
首先我们需要更改列名,将“0”、“1”、“2”改为有实际意义的名称,例如“DateTime”、“user”和“messages”,然后将数据集命名为“whatsapp_df”。下图展示了如何将文本文件转换为数据帧 (DataFrame)。
def txtTodf(txt_file):
    '''Convert WhatsApp chat log text file to a Pandas dataframe.'''

    # some regex to account for messages taking up multiple lines
    pat = re.compile(r'^(\d\d\/\d\d\/\d\d\d\d.*?)(?=^^\d\d\/\d\d\/\d\d\d\d|\Z)', re.S | re.M)
    with open(txt_file) as file:
        data = [m.group(1).strip().replace('\n', ' ') for m in pat.finditer(file.read())]

    user     = [];
    message  = [];
    datetime = []

    for row in data:

        # timestamp is before the first dash
        datetime.append(row.split(' - ')[0])

        # sender is between am/pm, dash and colon
        try:
            s = re.search('m - (.*?):', row).group(1)
            user.append(s)
        except:
            user.append('')

        # message content is after the first colon
        try:
            message.append(row.split(': ', 1)[1])
        except:
            message.append('')

    df = pd.DataFrame(zip(datetime, user, message), columns=['datetime', 'user', 'message'])
    df['datetime'] = pd.to_datetime(df.datetime, format='%d/%m/%Y, %I:%M %p')

    # remove events not associated with a sender
    df = df[df.user != ''].reset_index(drop=True)

    return df

whatsapp_df = txtTodf('Chat.txt')
将文本文件转换为数据帧 (DataFrame)
- 清洁图像数据
完成以上转换后,现在我们要清除文本文件中所有的图像/媒体数据,因为我们要对文本而不是图像进行分析。
以下两图显示了如何删除图像文件。
# To understand the number od the image dataimg = whatsapp_df[whatsapp_df['message'] == "<Media omitted>" ]img.shape(1182, 3)
检测图像数量
# We will drop all the image file by using the Drop functionswhatsapp_df.drop(img.index, inplace=True)
清除所有图像/媒体数据
03 下面让我们开始探索性数据分析(EDA)吧
问题1:群聊中哪些用户发的消息最多?
在WhatsApp分析中,我们通常比较关心哪些用户比较活跃,也就是发消息最多。
使用pandas:
首先,我们可以使用pandas来理解数据,并对数据进行ascending排序。可以看到,该群聊中发消息最多的人是“ Rohit”。
#Creating a new dataframe by copying the old dataframe
whatsapp_df1 = whatsapp_df.copy()
whatsapp_df1['Number_of_messages'] = [1]* whatsapp_df1.shape[0]
whatsapp_df1.drop(columns = 'datetime', inplace = True)

#We are groupby the user and messages together then we will use count() to count the messages for each of user
whatsapp_df1 = whatsapp_df1.groupby('user')['Number_of_messages'].count().sort_values(ascending = False).reset_index()
whatsapp_df1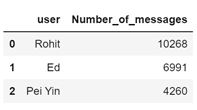
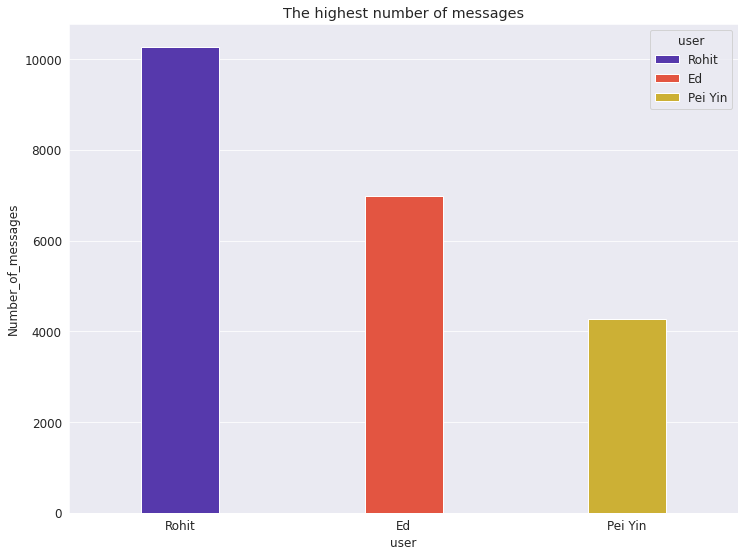
数据可视化:
下面,我们将使用线图和柱状图进行数据可视化。结果显示,“Rohit”发的消息最多,大约有一万条,这表明“Rohit”是群里非常活跃的成员。
#  Using seaborn for Styles
sns.set_style("darkgrid")

# Resize the  figure size
plt.figure(figsize=(12, 9))

# Here we are ploting the line chart using plt.plot
plt.plot(whatsapp_df1.user, whatsapp_df1.Number_of_messages, 'o--c')

# In here we are writing the Labels and Title for the plot chart
plt.xlabel('Users')
plt.ylabel('Total number of messages')

plt.title("The highest number of messages send by the user")
plt.legend(['Messages send']);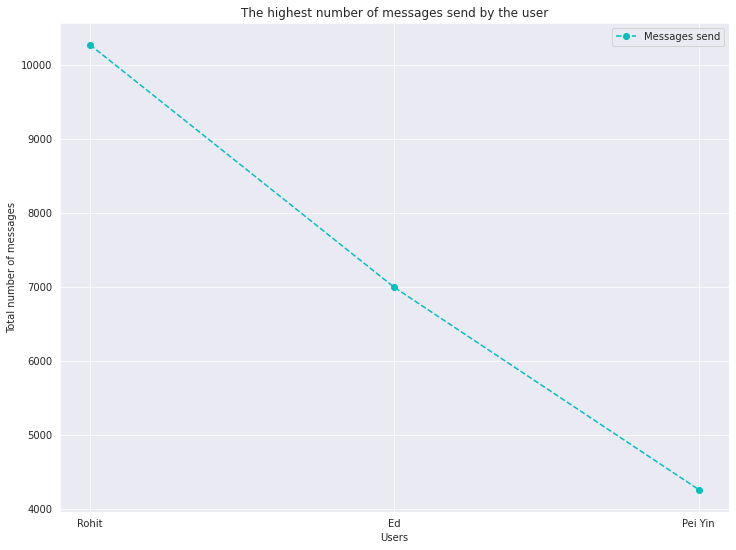
#Formating
sns.set_style("darkgrid")

#The background of the chart
matplotlib.rcParams['font.size'] = 12
matplotlib.rcParams['figure.figsize'] = (12, 9)
matplotlib.rcParams['figure.facecolor'] = '#00000000'
fig, ax = plt.subplots()

#Creating a bar chart
sns.barplot(whatsapp_df1.user,whatsapp_df1.Number_of_messages,hue='user',data=whatsapp_df1,dodge=False,palette="CMRmap")

#The title of our charts
plt.title("The highest number of messages")

#Change the width of the bar chart plot
def change_width(ax, new_value) :
    for patch in ax.patches :
        current_width = patch.get_width()
        diff = current_width - new_value

        # we change the bar width
        patch.set_width(new_value)

        # we recenter the bar
        patch.set_x(patch.get_x() + diff * .5)

change_width(ax, .35)
plt.show()
/srv/conda/envs/notebook/lib/python3.7/site-packages/seaborn/_decorators.py:43: FutureWarning: Pass the following variables as keyword args: x, y. From version 0.12, the only valid positional argument will be `data`, and passing other arguments without an explicit keyword will result in an error or misinterpretation. FutureWarning
问题2:哪些表情符号最经常被使用?每个成员分别最喜欢使用哪些表情符号?
现在我们想知道哪种表情符号被用户广泛使用。一般来说,这些表情符号未来被使用的概率也很高。
使用pandas:
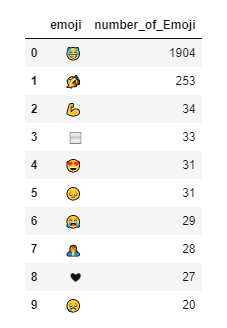
下图所示, 我的WhatsApp群聊中使用最多的表情符号是“笑哭表情”😂 (Face with Tears of Joy)。
#This will help to create or rendered the emoji
emojis_df = pd.DataFrame() #The reason to use pd.dataframe is we want to put the emojis_df into the dataframe tables
emojis_df['emoji'] = [''] * 10
emojis_df['number_of_Emoji'] = [0] * 10

i = 0
for item in emoji_ctr.most_common(10):
    emojis_df.emoji[i] = item[0]
    emojis_df.number_of_Emoji[i] = int(item[1])

    i += 1

emojis_df
/srv/conda/envs/notebook/lib/python3.7/site-packages/ipykernel_launcher.py:8: SettingWithCopyWarning: A value is trying to be set on a copy of a slice from a DataFrameSee the caveats in the documentation: https://pandas.pydata.org/pandas-docs/stable/user_guide/indexing.html#returning-a-view-versus-a-copy /srv/conda/envs/notebook/lib/python3.7/site-packages/ipykernel_launcher.py:9: SettingWithCopyWarning: A value is trying to be set on a copy of a slice from a DataFrameSee the caveats in the documentation: https://pandas.pydata.org/pandas-docs/stable/user_guide/indexing.html#returning-a-view-versus-a-copy if __name__ == ‘__main__’:
数据可视化
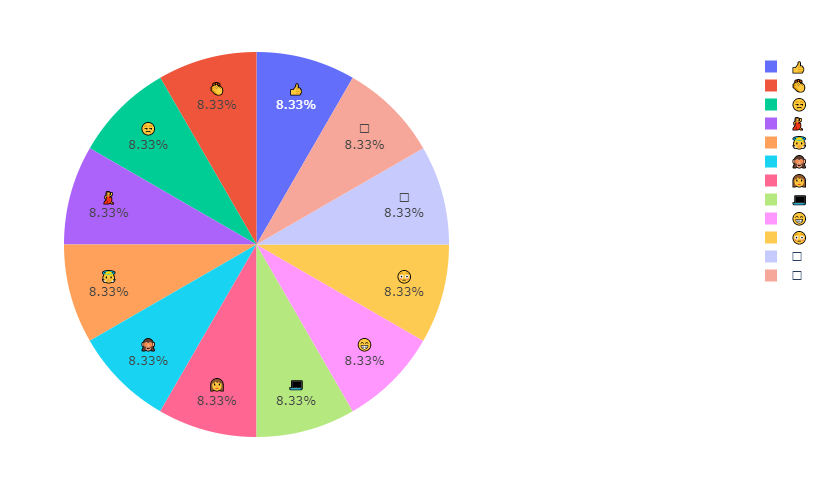
首先,让我们看一下所有用户最喜欢使用的表情符号。从下图可以看出,群聊中最常用的表情符号是“笑哭表情”😂 (Face with Tears of Joy),占总体的79.7%。也就是说,大多数情况下,用户在此群聊中使用的表情符号会是“笑哭表情”😂 (Face with Tears of Joy) 。
#This pei chart give us and ideas the overall view of which emoji use the most
fig = px.pie(emojis_df, values='number_of_Emoji', names='emoji',title='Emoji percentage used in chat group')
fig.update_traces(textposition='inside', textinfo='percent+label')
fig.show()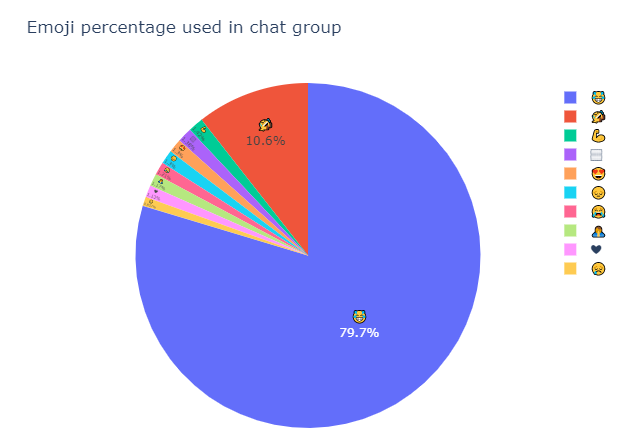
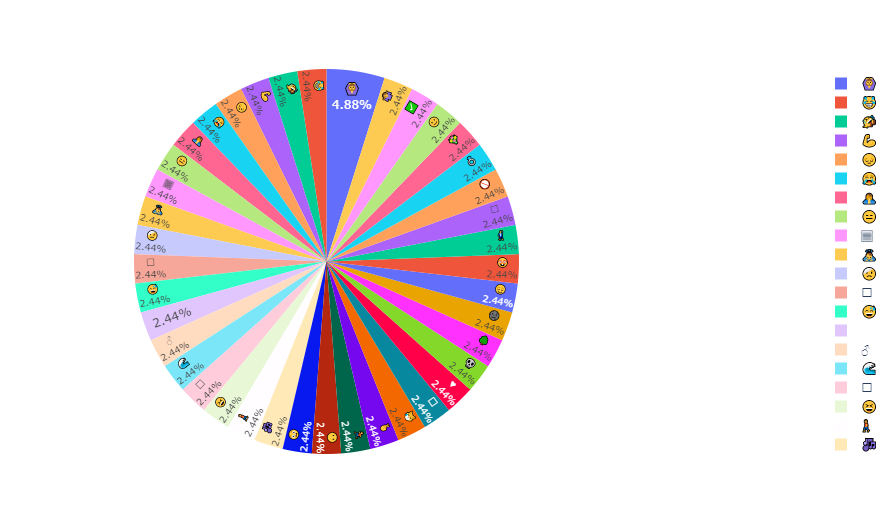
接下来,让我们看一下每个成员分别最喜欢使用哪些表情符号。
用户:Ed
- 该用户最常使用“抱头手势” (Woman Gesturing OK) 表情符号;
- 第二个是“笑哭表情”😂 (Face with Tears of Joy)。
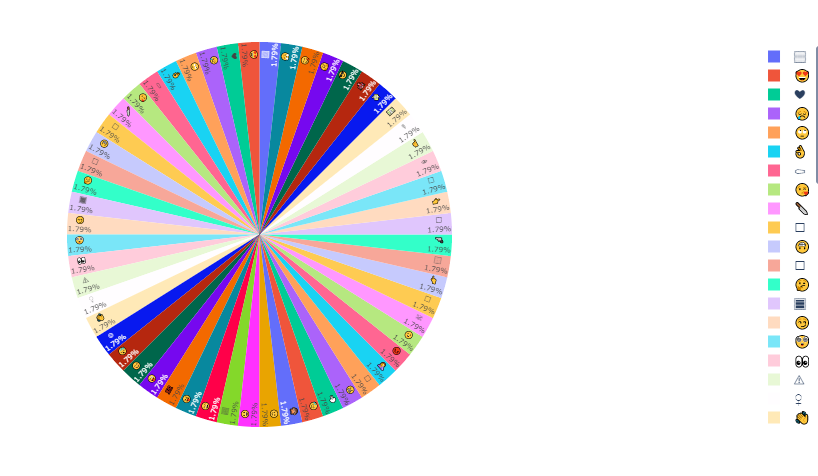
用户:Rohit
- 该用户在群聊中使用了多种表情符号,因此我们无法确定他最常使用或未来使用哪种表情符号。
用户:Pei Yin
- 该用户最常使用“竖起大拇指” (Thumbs Up) 和“拍手” (Clapping) 这两个表情符号。
l = emojis_df.user.unique()
for i in range(len(l)):
    dummy_df = emojis_df[emojis_df['user'] == l[i]]
    emojis_list = list([a for b in dummy_df.emoji for a in b])
    emoji_dict = dict(Counter(emojis_list))
    emoji_dict = sorted(emoji_dict.items(), key=lambda x: x[1], reverse=True)
    print('Emoji Distribution for', l[i])
    user_emoji_df = pd.DataFrame(emoji_dict, columns=['emoji', 'count'])
    fig = px.pie(user_emoji_df, values='count', names='emoji')
    fig.update_traces(textposition='inside', textinfo='percent+label')
    fig.show()
Emoji Distribution for Ed
问题3:WhatsApp群聊最活跃的时间
这个问题有助于我们了解所有成员在WhatsApp群聊中最活跃的时间。我们选择了两个变量,消息个数和时长。
使用pandas:
在这个数据集中,WhatsApp群聊活跃的时间加起来长达1300个小时。
#Copy a dataframe
whatsapp_df3 = whatsapp_df.copy()

whatsapp_df3['number_of_message'] = [1] * whatsapp_df3.shape[0]

whatsapp_df3['hours'] = whatsapp_df3['datetime'].apply(lambda x: x.hour)

time_df = whatsapp_df3.groupby('hours').count().reset_index().sort_values(by = 'hours')
time_df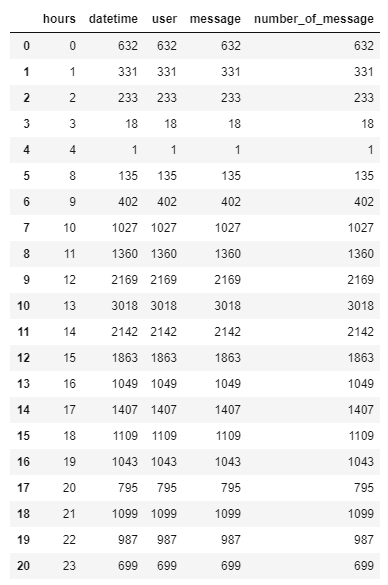
数据可视化:
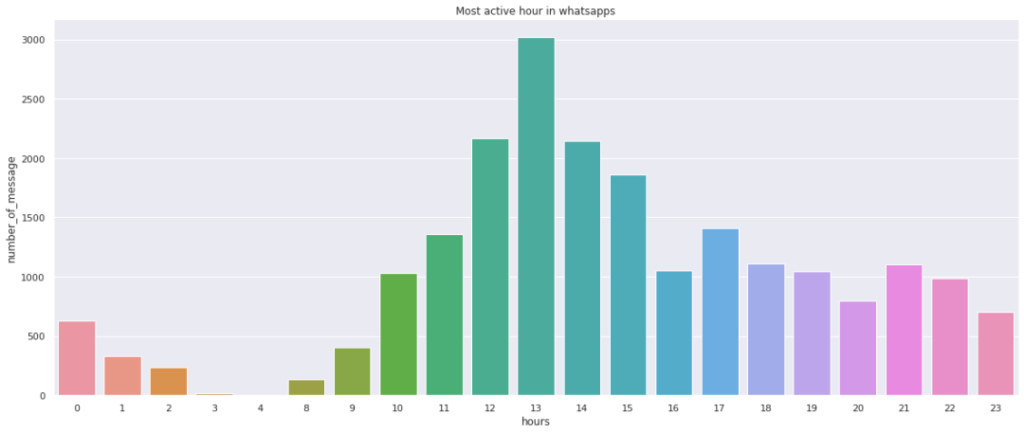
我们刚刚发现WhatsApp中最活跃的时间是1300小时。
除此之外,我们发现,在数据集涵盖的8个月时间里,在早上5点至7点之间没有用户处于活跃状态,但凌晨12点至2点之间仍有用户处于活跃状态。因此可以推断,大多数用户都睡得很晚。
#Create the formatting of the graph
matplotlib.rcParams['font.size'] = 20
matplotlib.rcParams['figure.figsize'] = (20, 8)

# Using the seaborn style
sns.set_style("darkgrid")

plt.title('Most active hour in whatsapps');
sns.barplot(time_df.hours,time_df.number_of_message,data = time_df,dodge=False)
/srv/conda/envs/notebook/lib/python3.7/site-packages/seaborn/_decorators.py:43: FutureWarning:Pass the following variables as keyword args: x, y. From version 0.12, the only valid positional argument will be `data`, and passing other arguments without an explicit keyword will result in an error or misinterpretation.
<AxesSubplot:title={‘center’:’Most active hour in whatsapps’}, xlabel=’hours’, ylabel=’number_of_message’>
问题4:大家几月份发消息最多?
群聊记录是从2020年2月5日到2020年9月21日的。我们想知道几月份大家发的消息最多。
使用pandas:
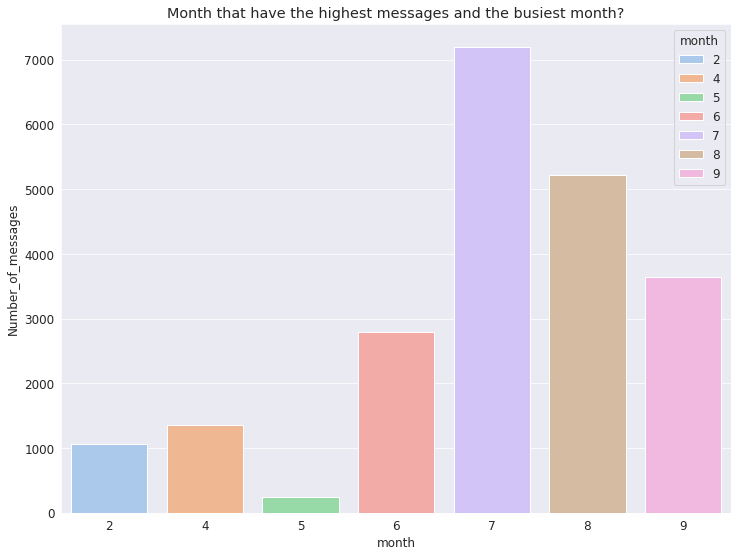
下图所示,七月份大家发的消息最多。
whatsapp_df4 = whatsapp_df.copy()
whatsapp_df4['Number_of_messages'] = [1] * whatsapp_df4.shape[0]

whatsapp_df4['month'] = whatsapp_df4['datetime'].apply(lambda x: x.month)

df_month = whatsapp_df4.groupby('month')['Number_of_messages'].count().sort_values(ascending = False).reset_index()
df_month.head()
数据可视化:
在这里,我们发现七月份大家发的消息最多,一共有7000条左右,用户都很活跃,可能在交流学习等等。八月份聊天则有所减少,大概率是由于作业和考试都Due了,大家都忙于在截至日期前提交作业。
另外,表里没有二、三月份,这是因为这段时间马来西亚由于疫情在进行大面积封锁,学校也暂时停课了。因此,直到四月份学校开始远程授课后,群聊成员们才打破沉默。五月份学校放假,因此我们又迎来了一段时间的沉默。
#Formating
sns.set_style("darkgrid")

#The background of the chart
matplotlib.rcParams['font.size'] = 12
matplotlib.rcParams['figure.figsize'] = (12, 9)
matplotlib.rcParams['figure.facecolor'] = '#00000000'
fig, ax = plt.subplots()

#Creating a bar chart
sns.barplot(x=df_month.month,y=df_month.Number_of_messages ,hue='month',data=df_month,dodge=False,palette="pastel")
plt.title("Month that have the highest messages and the busiest month?")
Text(0.5, 1.0, ‘Month that have the highest messages and the busiest month?’)
问题5:用户最常使用的单词或词组有哪些?
这一部分,我们使用词云图对群聊中最常出现的单词或词组进行可视化,以直观看出用户最常使用的单词或词组有哪些。通过这种分析,我们可以更加了解用户的行为,预测用户将来可能在其他聊天中经常使用的单词或词组,推测其聊天内容。
数据可视化:
下图所示,我们使用最多的单词是“ la”。“la”并没有具体的含义,但马来西亚人很喜欢在句尾说 “la”,例如“Yes la”、“No la”、 “Okay la”、 “coming la”等等。
wordcloud.to_image()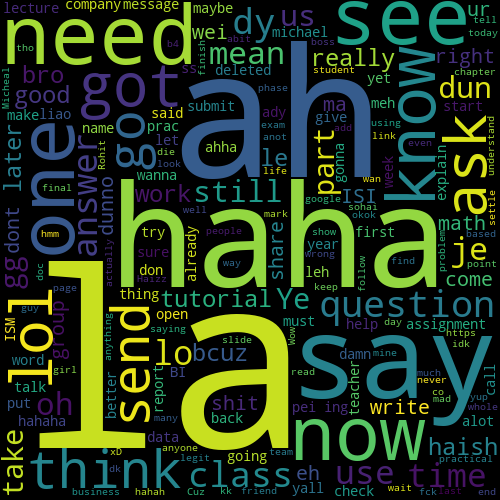
以上就是WhatsApp对话分析项目的全部内容,完整代码及详细说明见https://jovian.ai/edsenmichaelcy/whatsapp-chat-analysis-course-project.谢谢!你还可以订阅我们的YouTube频道,观看大量数据科学相关公开课:https://www.youtube.com/channel/UCa8NLpvi70mHVsW4J_x9OeQ;在LinkedIn上关注我们,扩展你的人际网络!https://www.linkedin.com/company/dataapplab/
原文作者:MichaelChiaYin
翻译作者:Haoran Qiu
美工编辑:过儿
校对审稿:Dongdong
原文链接:https://medium.com/jovianml/whatsapp-message-exploratory-data-analysis-eda-538560ee1c99


