
10个Python函数,帮你解决70%的数据分析问题
数据科学家的日常工作会涉及各种任务,常见的有数据预处理,数据分析,机器学习模型创建,模型部署等等。
如果你想成为一名数据科学家,那你要做的第一步就是培养你的数据处理技能,因为几乎每个数据科学项目都需要这个技能。处理数据时,需要首先读取数据,并将其转换为表单,然后你就可以通过数据回答问题了。而Python编程语言就有针对数据操作和数据分析工作的 Pandas 库。

在这篇文章中,我将概述每一个数据科学家都应该知道的10个python(pandas)操作。如果你想了解更多数据分析相关内容,可以阅读以下这些文章:
手把手教你用Python创建SQL数据库!
5个鲜为人知的 Python 库!帮你的下一个NLP项目起航
从Marplotlib到Plotly: 教你入门Python数据可视化
如何征服数据科学面试中的Python编程考试
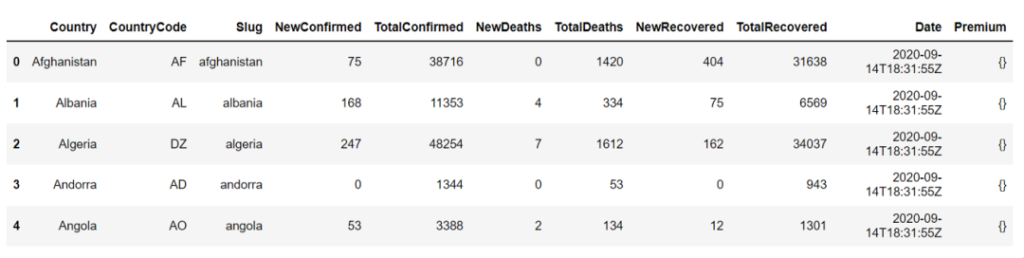
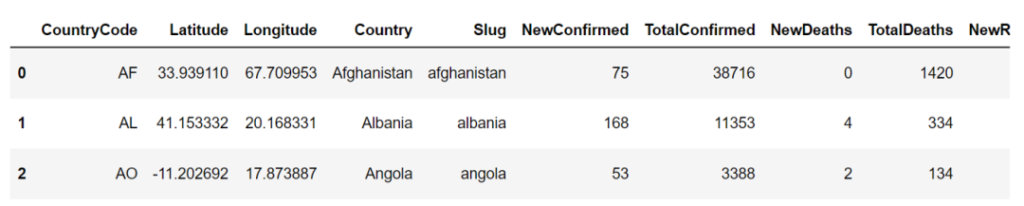
1. 阅读数据集:数据是每一个分析的组成部分。了解如何从不同的文件格式读取数据,如:csv, excel,文本等,这是你作为一个数据科学家应该熟练的第一步。下面是一个例子,教你如何用pandas读取包含Covid-19数据的csv文件。
import pandas as pd# reading the countries_data file along with the location within read_csv function.countries_df = pd.read_csv('C:/Users/anmol/Desktop/Courses/Python for Data Science/Code/countries_data.csv')# showing the first 5 rows of the dataframecountries_df.head()
下面是country_df .head()的输出,我们可以看到数据帧的前5行:
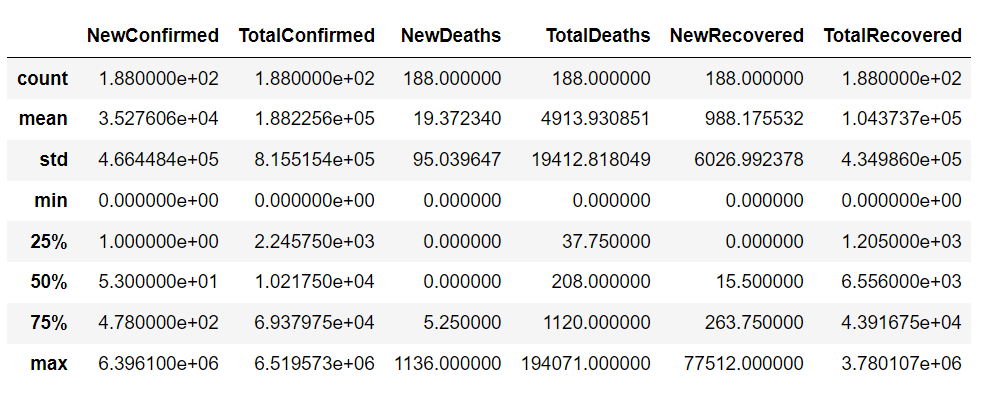
2.统计信息汇总:读取数据后,下一步就是通过查看数据的汇总来了解数据,例如 NewConfirmed、TotalConfirmed 等数字列的计数、均值、标准偏差(std)等等,以及国家,国家代码等列出现的频率,最高出现的值等。
使用descripe函数,我们可以得到的数据集的连续变量汇总如下图所示:
#get summary of continuous variablescountries_df.describe()
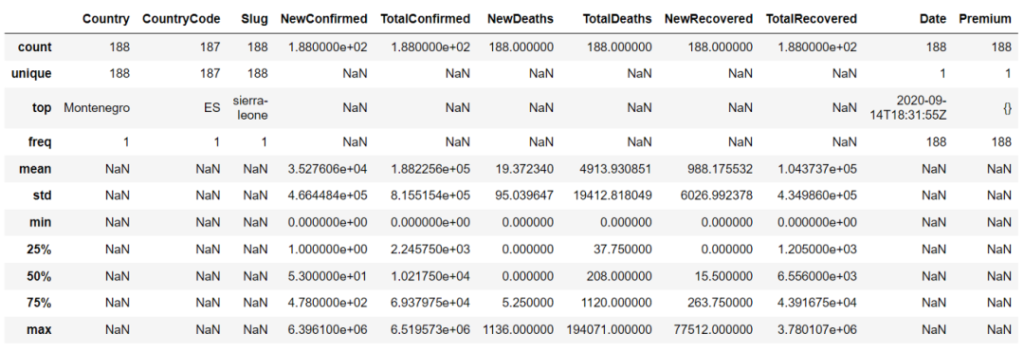
describe函数中,我们可以设置参数“include = ‘ all ‘”来获得连续变量和类别变量的总结。
#get summary of continuous and categorical variablescountries_df.describe(include = 'all')
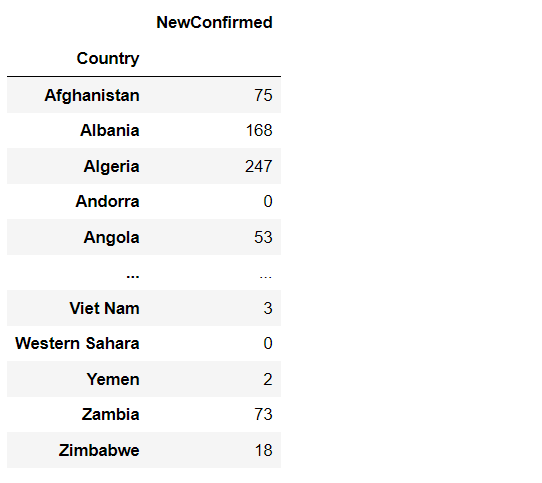
3. 数据选择和过滤:数据分析并不一定需要数据集的所有行和列。你可以选择感兴趣的列,并根据你要回答的问题过滤一些行。
例如,我们可以使用以下代码选择Country和NewConfirmed列:
# selecting Country and NewConfirmed columnscountries_df[['Country','NewConfirmed']]

我们还可以将美国作为目标国家过滤数据。使用loc,我们可以根据如下所示的某些值来过滤列:
# filtering USA using country columncountries_df.loc[countries_df['Country'] == 'United States of America']

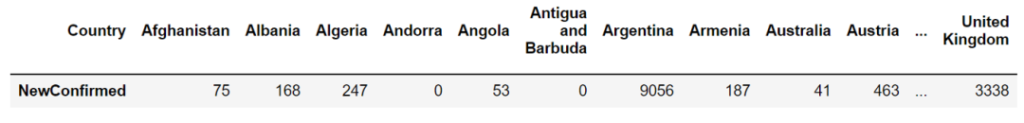
4. 聚合(Aggregation):在不同的变量分组中查找数字汇总,如计数、总和、平均值等,这就是数据聚合。这也是数据科学家最常执行的任务之一。
我们可以通过聚合找到各个国家的新确诊病例总数。聚合是使用groupby和agg函数执行的。在groupby函数中,我们要提供执行聚合的级别(Country列),在聚合函数中,我们要提供列名(NewConfirmed)和想要执行的数学运算(sum)。
# total NewConfirmed cases across countriescountries_df.groupby(['Country']).agg({'NewConfirmed':'sum'})
5. Join:使用Join函数,可以将2个数据集组合成一个单独的数据集。很多时候,不同的数据集中存在不同的信息,例如,一个数据集可能包含不同国家的Covid-19病例数,另一个数据集可能包含不同国家的纬度和经度信息。现在,如果我们需要合并这两个信息,那么我们可以执行一个连接操作,如下图所示:
#reading countires lat and lon datacountries_lat_lon = pd.read_excel('C:/Users/anmol/Desktop/Courses/Python for Data Science/Code/countries_lat_lon.xlsx')# joining the 2 dataframe : countries_df and countries_lat_lon# syntax : pd.merge(left_df, right_df, on = 'on_column', how = 'type_of_join')joined_df = pd.merge(countries_df, countries_lat_lon, on = 'CountryCode', how = 'inner')joined_df
6. 内置函数:了解数学内置函数,如min(), max(), mean(), sum()等,可以对不同的分析非常有帮助。通过调用这些函数,我们可以直接在数据帧上应用这些函数。这些函数可以单独在列上使用,也可以在聚合函数中使用,如下所示:
# finding sum of NewConfirmed cases of all the countriescountries_df['NewConfirmed'].sum()# Output : 6,631,899# finding the sum of NewConfirmed cases across different countriescountries_df.groupby(['Country']).agg({'NewConfirmed':'sum'})# Output# NewConfirmed#Country#Afghanistan 75#Albania 168#Algeria 247#Andorra 0#Angola 53
7. 用户自定义函数:我们自己编写的函数就是用户自定义函数。我们可以在任何需要的时候,通过调用该函数来执行这些函数中的代码。例如,我们可以创建一个函数来添加两个数字,如下所示:
# User defined function is created using 'def' keyword, followed by function definition - 'addition()'# and 2 arguments num1 and num2def addition(num1, num2):return num1+num2# calling the function using function name and providing the argumentsprint(addition(1,2))#output : 3
8. PIVOT:透视是将一列中的行中的唯一值们转换到多个新列,这是先进的数据处理技术之一。在Covid-19数据集上使用pivot_table()函数,我们可以将国家名称转换为单个新列:
# using pivot_table to convert values within the Country column into individual columns and# filling the values corresponding to these columns with numeric variable - NewConfimedpivot_df = pd.pivot_table(countries_df, columns = 'Country', values = 'NewConfirmed')pivot_df
9. 迭代数据帧:很多时候,我们需要迭代数据帧的索引和行。我们可以使用iterrows函数对数据帧进行迭代:
# iterating over the index and row of a dataframe using iterrows() functionfor index, row in countries_df.iterrows():print('Index is ' + str(index))print('Country is '+ str(row['Country']))# Output :# Index is 0# Country is Afghanistan# Index is 1# Country is Albania# .......
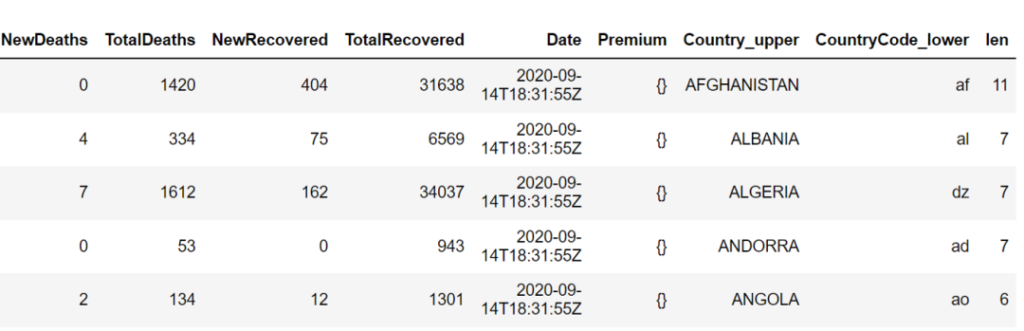
10. 字符串操作:很多时候,我们要在数据集中处理字符串列,在这种情况下,了解一些基本的字符串操作是很重要的,比如如何将字符串转换成大写、小写,以及如何在列中找到字符串的长度。
# country column to upper casecountries_df['Country_upper'] = countries_df['Country'].str.upper()# country column to lower casecountries_df['CountryCode_lower']=countries_df['CountryCode'].str.lower()# finding length of characters in the country columncountries_df['len'] = countries_df['Country'].str.len()countries_df.head()
这就是本文的全部内容!了解这10个操作将满足你大部分的数据处理需求。我希望本教程对你有所帮助,并且可以用作你未来工作或学习中Python的参考。祝你的数据科学之旅顺利,学习愉快!你还可以订阅我们的YouTube频道,观看大量数据科学相关公开课:https://www.youtube.com/channel/UCa8NLpvi70mHVsW4J_x9OeQ;在LinkedIn上关注我们,扩展你的人际网络!https://www.linkedin.com/company/dataapplab/
原文作者:Anmol Tomar
翻译作者:Lia
美工编辑:过儿
校对审稿:Jiawei Tong
原文链接:https://medium.com/codex/top-10-python-operations-that-every-aspiring-data-scientist-should-know-92b6f9a98ff9


