
使用 SafeGraph ,获取智能位置解析
在SafeGraph 官网上,他们表示有 1100 万多条兴趣点 (POI) 记录,包括位置、品牌等数据。
在查看了他们的文档后(https://docs.safegraph.com/docs),我发现主要包含了 3 种数据集:位置、几何、和模式(SafeGraph最近还引入了一个新的消费数据集)。本文中将结合 3 种主要类型的数据,演示SafeGraph 的数据用例。如果你想了解更多数据分析相关内容,可以阅读以下这些文章:
Python机器学习库:pycarets新增时间序列模块
机器学习VS深度学习:有什么区别?
如何回答ML机器学习的面试问题?
机器学习面试,你必须知道这些数学知识
SafeGraph API✦
首先,假设我是一个店主,店铺所在位置交通繁忙,我需要更多访客的具体信息。我将选择范围缩小到零售店、杂货店,这些地方基本上都是人们经常光顾的地方(即使在新冠疫情期间)。我选择了我们家最喜欢去的杂货店——大中华超市(GW Supermarket),位于德卢斯(Duluth)地区,距亚特兰大不到一小时车程(Atlanta)。
大中华超市在当地非常有名,因为超市食品种类很多,店面也很大。我听说过有人经常从临近州开车到这个超市,买吃的然后放在车用冷藏箱里,然后马上回家。接下来,让我们看看 SafeGraph 能否提供有关大中华超市访客是从哪里来的位置信息。
如果运行正常,我们可以用 SafeGraph的核心 API 查找大中华超市的 placekey(我们需要查询模式信息)。
import safegraphql.client as sgql

sgql_client = sgql.HTTP_Client(apikey = 'BLAH')

location_name = 'GW Supermarket'

street_address = '2300 Pleasant Hill Rd'

city = 'Duluth'

region = 'GA'

iso_country_code = 'US'

cols = [

    'location_name',

    'street_address',

    'city',

    'region',

    'iso_country_code',

    'postal_code'

]

sgql_client.lookup_by_name(

    product = 'core',

    location_name = location_name,

    street_address = street_address,

    city = city,

    region = region,

    iso_country_code = iso_country_code,

    columns = cols

)
运行成功!我们现在拿到了大中华超市的 placekey!

我们可以通过SafeGraph 核心和每月 API模式,使用这个placekey,查询相关信息:
import numpy as np

import safegraphql.client as sgql

from matplotlib import pyplot as plt

import pandas as pd

import geopandas as gpd

sgql_client = sgql.HTTP_Client(apikey = 'BLAH')

pk = ['zzw-223@8g6-ytb-qxq']

cols = [

    'latitude',

    'longitude',

    'street_address',

    'city',

    'region',

    'postal_code',

    'iso_country_code',

    'parent_placekey',

    'location_name',

    'safegraph_brand_ids',

    'brands',

    'top_category',

    'sub_category',

    'naics_code',

    'phone_number',

    'open_hours',

    'category_tags',

    'opened_on',

    'closed_on'

]

df_core=sgql_client.lookup(product = 'core', placekeys = pk, columns = cols)

cols = [

    'date_range_start',

    'date_range_end',

    'raw_visit_counts',

    'raw_visitor_counts',

    'visits_by_day',

    'poi_cbg',

    'popularity_by_hour',

    'visitor_home_cbgs',

    'visitor_home_aggregation',

    'visitor_daytime_cbgs',

    'visitor_country_of_origin',

    'distance_from_home',

    'bucketed_dwell_times',

    'median_dwell',

    'related_same_day_brand',

    'related_same_month_brand',

    'popularity_by_day',

    'device_type'

]

df_patt=sgql_client.lookup(product = 'monthly_patterns', placekeys = pk, columns = cols)

#merging core and monthly patterns data

df=df_core.merge(df_patt)

df_days=pd.DataFrame(df['popularity_by_day'][0].items(),columns=['Day','visits'])

df_rel=pd.DataFrame(df['related_same_month_brand'][0].items(),columns=['Brand','visits'])

#plotting visits by day for the month of December 2021

fig = px.line(df_days,x="Day",y="visits")

fig.show()

#plotting visits by day for related brands (Other brands that the visitors to this POI visited in the same month as the visit to this POI. )

#during the month of December 2021

fig = px.line(df_rel,x="Brand",y="visits")

fig.show()

#plotting visits by hour for the month of December 2021

df_hour=pd.DataFrame([np.linspace(0,23,24),df['popularity_by_hour'][0]]).T

df_hour.columns=['Hour','visits']

fig = px.line(df_hour,x="Hour",y="visits")

fig.show()
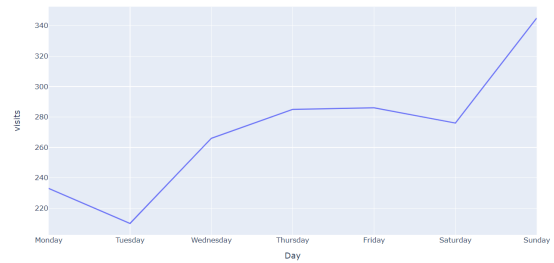
可以看到,周六和周日人流量最大的,周一和周二最小。就我个人而言 —— 我喜欢在每周的后面几天买东西。
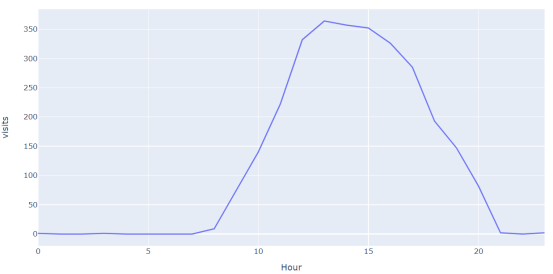
按小时计算的访问量显示,高峰时间为上午 11 点至下午 5 点。我通常在上午 10 点或下午 2 点去大中华超市,但从没有真正注意到哪个时间人流量更大。看来下次我们买东西时,我可以留意一下!
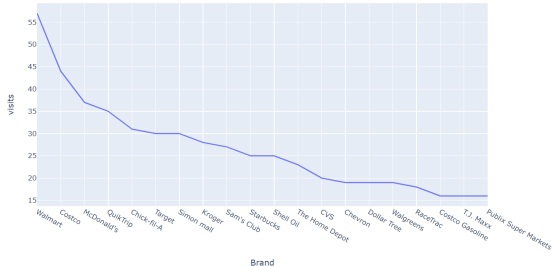
去大中华超市的游客更有可能去Walmart、Costco和McDonald ’s。在地理位置方面;Walmart就在大中华超市对面,最近的 Costco 也在 1.5 英里之外。美国的Costco 超市非常少。所以这个结论是说得通的。
SafeGraph 几何图形✦
我刚刚向你展示了 SafeGraph 的位置和模式功能。但 SafeGraph 还有另一个强大的几何特性——理解和可视化地理空间趋势。具体来说,我感兴趣的问题是:大中华超市的访客主要来自哪些地方?他们是本地人吗?还是其他州的?
大中华超市访问数据对应的数据帧是以行为单位。某些列包含可用来推断用户来自哪里的字典。具体来说,“visitor_daytime_CBGs”列包含了访客数量,和主要人口普查区块组 (CBG) ID。但是,这个 CBG 编号并没有告诉我们任何有关位置的信息。那么我们如何获得 CBGs 的位置和几何形状呢?
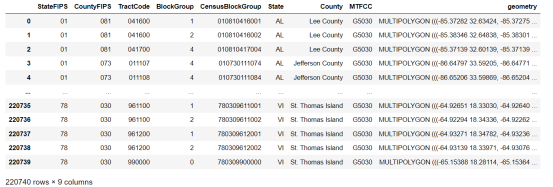
为此,我用了 SafeGraph 提供的人口普查数据(https://www.safegraph.com/free-data/open-census-data)。 CBG 几何数据是 geojson 格式,可以通过 geopandas 读取。
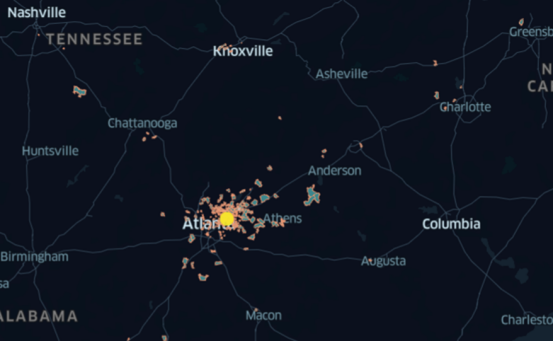
最后,我把它保存为 geojson ,并使用 kepler.gl来可视化 CBG 访问的 Choropleth 地图,以及大中华超市的位置(大黄点)。
import safegraphql.client as sgql

from matplotlib import pyplot as plt

import pandas as pd

import geopandas as gpd

#creating a dataframe containing visitor daytime CBGs information

df_trips=pd.DataFrame(list(df['visitor_daytime_CBGs'][0].items()), columns=['CBG','trips'])

#loading CBG geometries geojson

geom = gpd.read_file('./safegraph_open_census_data_2010_to_2019_geometry/CBG.geojson')

df_trips_geom=geom.merge(df_trips,how='inner',right_on='CBG',left_on='CensusBlockGroup')

df_tg2h=df_trips_geom[['trips','geometry']]

df_tg2h.to_file("df_tg2h.geojson", driver='GeoJSON')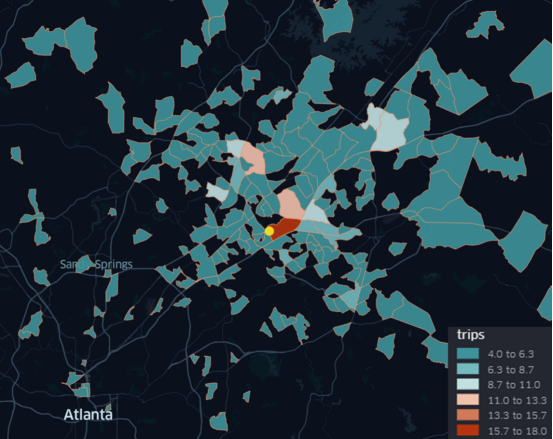
放大图片,你可以看到乔治亚州(Georgia)以外的 CBG 的访客,包括田纳西州(Tennessee)和北卡罗来纳州(North Carolina)!看来,真的有不少人开好几个小时车去大中华超市购物!
文章要点✦
SafeGraph 数据给大家提供了很多位置相关的见解, API 也非常友好。网络上介绍案例的教程并不多,可能是因为该公司还是新初创公司。对于那些想要找到位置的见解、而又不想投资于密集架构,而跟踪商店访问的公司来说,SafeGragh非常有吸引力。
根据你的需要,数据有好有坏。好消息是, SafeGraph 已经做了一些初步分析(分析非常细致!),让你可以用他们模板数据找到见解。此外,这种聚合也免除了一些隐私问题。但缺点是你可能会错过一些可能有用的访问细节。
总体而言,SafeGraph 是提供位置见解的绝佳工具。最近有很多研究通过 SafeGraph 数据解释重要研究问题,特别是与新冠疫情期间人们的移动模式相关的问题。我相信,未来几年,使用 SafeGraph 进行位置智能的研究人员和公司的数量将会只增不减!
如果你喜欢这篇文章,欢如果你喜欢这篇文章,欢迎关注我们!你还可以订阅我们的YouTube频道,观看大量数据科学相关公开课:https://www.youtube.com/channel/UCa8NLpvi70mHVsW4J_x9OeQ;在LinkedIn上关注我们,扩展你的人际网络!https://www.linkedin.com/company/dataapplab/
原文作者:Skanda Vivek
翻译作者:Lia
美工编辑:过儿
校对审稿:Jiawei Tong
原文链接:https://towardsdatascience.com/deriving-location-intelligence-insights-using-safegraph-d53803e239cb


